Smarter Automation Using Artificial Intelligence in Automation Testing
Discover how artificial intelligence in automation testing is revolutionizing QA. Learn practical strategies, key benefits, and how to implement AI today.
Discover roi in automation: a practical framework to build a solid business case, prove value, and justify tech investments.
Automate and scale manual testing with AI ->
Calculating the return on investment (ROI) in automation is much more than a simple cost-cutting exercise. It’s about drawing a straight line from your technical efforts to real business outcomes. A well-crafted ROI demonstrates that automation isn’t just another expense—it’s a strategic engine that speeds up product delivery, boosts quality, and frees up your best engineers for more creative work.
The goal is to connect what your team does every day directly to the metrics that leadership cares about.
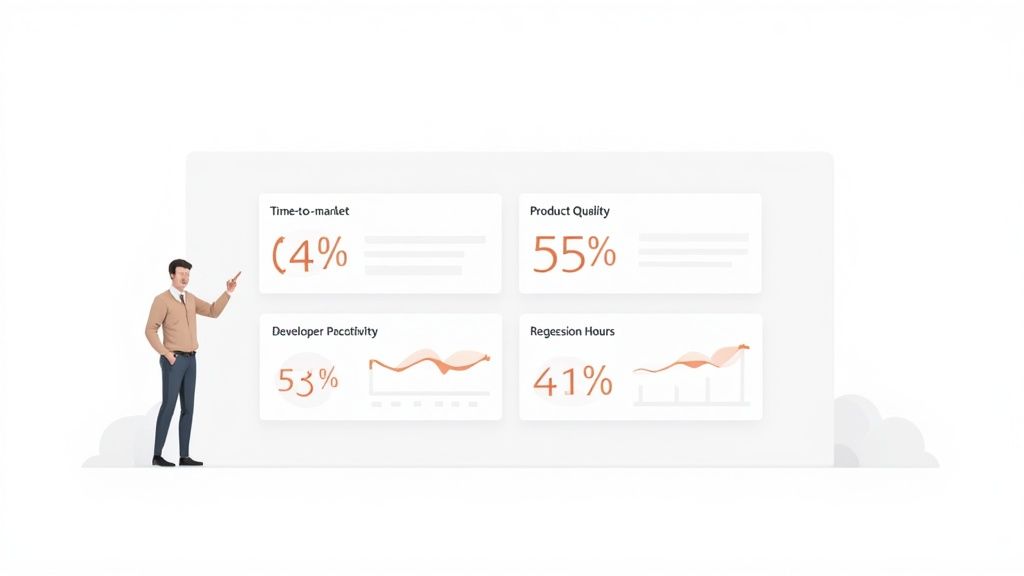
Before you can build a compelling business case, you have to define what “value” actually means for your automation program. This means looking past the obvious benefit of replacing manual labor and exploring the full spectrum of gains, from a faster time-to-market to a more stable product. You need to create a clear line of sight from the company’s biggest goals all the way down to your QA team’s daily tasks.
For example, a high-level goal like “increase market share” might seem worlds away from test automation. But think it through. Automation enables faster release cycles, which lets you ship new features before your competitors. It also means fewer bugs make it to production, which improves customer retention. Both of these directly fuel the mission to capture more of the market. To get a better handle on the fundamentals, you can dig into what business process automation is and its benefits.
The most critical move is translating those lofty goals into concrete, measurable Key Performance Indicators (KPIs). These metrics are the bridge between your technical world and the business world. Stakeholders might not grasp the intricacies of your automation framework, but they definitely understand the impact of the right KPIs.
Here’s how that connection looks in practice:
This simple framing helps you pick metrics that actually mean something to leadership. Instead of talking about the number of “test scripts executed,” you can report “a 15% reduction in hotfix deployments.” That’s a language everyone understands—it clearly communicates better quality and stability.
This diagram perfectly illustrates the path from setting goals to defining KPIs and, finally, measuring true business value.
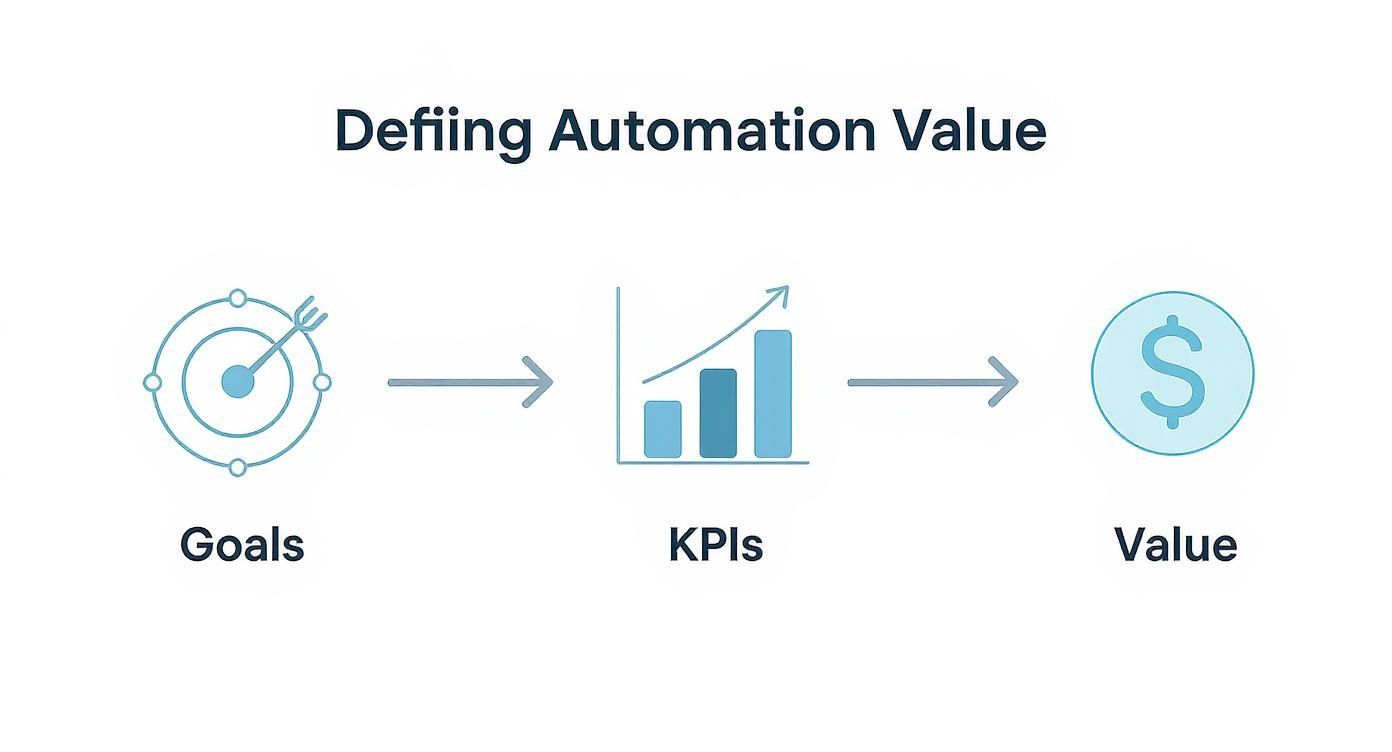
The takeaway is simple but powerful: value doesn’t just happen. It’s the direct result of aligning your automation work with the things that matter most to the business.
To make this connection even clearer, this table shows how to map high-level objectives to specific, trackable metrics for your automation program.
| Strategic Goal | Primary KPI | Secondary Metric |
|---|---|---|
| Increase Revenue | Faster Time-to-Market | Reduction in Release Cycle Time |
| Improve Customer Satisfaction | Decrease in Production Defects | Higher Net Promoter Score (NPS) |
| Enhance Operational Efficiency | Reduction in Manual QA Hours | Cost Savings on Labor |
| Boost Developer Productivity | Less Time Spent on Bug Fixes | Increase in Feature Velocity |
By creating these direct links, you can easily demonstrate how your team’s work contributes directly to the company’s bottom line.
While cutting down on manual testing hours is a big win, it’s just one piece of the puzzle. A truly comprehensive ROI model for automation must also include the indirect and intangible benefits. Honestly, these are often where the most profound, long-term impact comes from.
Think about the ripple effects of a great automation strategy:
The financial proof is there, too. On average, companies generate $5.44 in revenue for every $1 invested in marketing and sales automation. What’s more, a whopping 76% of companies report seeing ROI from their automation projects within the first year, which shows that the payback can be incredibly fast.
By defining value in both hard numbers and qualitative improvements, you paint a complete picture of automation’s impact. This balanced approach makes your ROI calculation not only more accurate but also helps you tell a compelling story about how technology is pushing the business forward.
To make a credible case for automation, you need to get brutally honest about both sides of the financial equation. It’s not enough to just say, “we’ll save time.” You have to put a number on that time and weigh it against the full, real-world investment required. This model is the financial backbone of your entire business case.
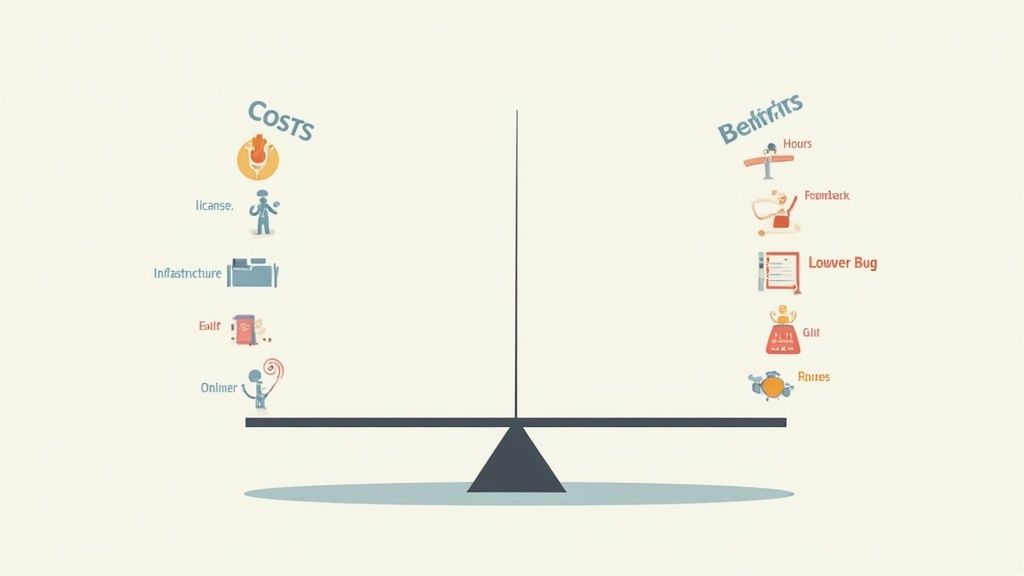
A solid cost-benefit model digs deeper than the obvious expenses. It has to account for the hard, upfront costs and the softer, ongoing operational investments. On the flip side, the “benefit” part of your model needs to capture direct savings along with those more strategic, indirect gains that often deliver the most significant long-term value.
When calculating costs, a classic mistake is to only look at the software licensing fees. The truth is, the total cost of ownership (TCO) is much broader, and frankly, it’s the only way to get a realistic picture of the investment you’re asking for.
Your cost model absolutely must include:
By mapping out these expenses, you’re showing leadership that you’ve done your homework and are presenting a transparent, realistic view of what the organization is committing to.
Now for the fun part. The “return” side of your model is where you connect your automation efforts directly to business value, blending hard savings with those game-changing strategic advantages.
These are the numbers that make finance folks sit up and listen. They’re the easiest benefits to calculate and are often the most immediately compelling. The biggest piece of this puzzle is the reduction in manual labor.
Let’s walk through a concrete example. Say your QA team spends 100 hours on manual regression testing for every release cycle. If you push a release monthly, that’s 1,200 hours per year. At a blended rate of $50/hour, this single activity costs you $60,000 annually. If automation can take over 80% of that effort, you’ve just found a $48,000 direct annual saving.
Indirect benefits are tougher to nail down with a precise dollar figure, but they are often far more impactful in the long run. These gains are the ripple effects of a smart automation strategy.
Think of it this way: direct savings help you justify the budget, but indirect gains are what truly propel the business forward. These are the benefits that give you a competitive edge.
Consider these powerful indirect gains:
The impact of workflow automation is well-documented; it’s been shown to slash data capture errors by 37% and boost overall data accuracy by an incredible 88%. As companies bring these tools on board, 32% report significant drops in human errors, proving how automation directly lifts quality.
By building a model that captures both the hard savings and these strategic advantages, your ROI calculation becomes less of a math problem and more of a powerful story about true business impact.
Assumptions are just that—assumptions. To get real buy-in, you need hard data. After you’ve built out your cost-benefit model, the next move is to prove it’s not just a hopeful spreadsheet. A focused pilot program is the single best way to swap guesswork for evidence, making your ROI in automation calculation rock-solid.
The idea isn’t to boil the ocean and automate everything overnight. Instead, you’ll pick a small but meaningful area of your application to serve as a real-world testbed. This is where you generate the concrete numbers needed to back up your financial projections and build serious momentum for a wider rollout.
Honestly, picking the right project for your pilot is half the battle. You’re looking for that sweet spot: high value, but with a manageable scope. An ideal candidate has a clear, repeatable workflow that’s currently eating up a ton of your team’s manual effort.
Good places to start often include:
A word of advice: steer clear of brand-new features or anything undergoing a major rewrite. The constant churn will make it impossible to get a stable baseline, and your maintenance costs will skyrocket, completely skewing your pilot results.
Before you write a single line of automation code, you have to measure everything about the current process. This baseline is your “before” picture. Without it, your “after” picture means nothing. The goal is to put hard numbers on the cost and effectiveness of how things are done today.
For your chosen pilot area, get obsessive about tracking these metrics:
Don’t skip this step. This data collection is non-negotiable. These are the numbers that will eventually make the case for you.
A pilot program is your chance to create a small-scale success story. By nailing it in one high-impact area, you demonstrate real, tangible value almost immediately. That’s how you build the political and financial capital needed to go big with automation.
With your baseline set, it’s go-time. This is where you implement the automation and then—you guessed it—track the exact same metrics you did before. Now you’ll have a direct, undeniable before-and-after comparison. For a great framework on how to structure this period, check out this guide on how to effectively run a 4-week prototype testing sprint.
During the pilot, you’ll also need to capture some new data points related to the automation itself:
Once the pilot is done, you can lay your baseline numbers side-by-side with your pilot results. The improvements—fewer hours, faster cycles, less escaped defects—are no longer theoretical. They are validated facts, ready to be plugged into your final ROI calculation and presented to stakeholders with complete confidence.
You’ve done the hard work. You’ve run the pilot, crunched the numbers, and now you have real data, not just theories. The next step is to turn that data into a story that gets decision-makers excited and ready to sign off.
A powerful business case isn’t just a spreadsheet of numbers. It’s a narrative that frames your ROI in automation as the clear, strategic solution to a real business headache. You’re not just asking for a tool; you’re offering a better outcome, and your job is to make that outcome so compelling they can’t say no.
A winning business case walks your stakeholders through a logical journey, starting with a problem they already recognize and ending with your data-backed solution. You want to anticipate their questions and have the answers ready before they even ask.
Think of it as building an argument from the ground up. Here’s how I’ve always found it best to structure the story:
This flow makes your case easy to follow and connects every part of your proposal back to what leaders care about most: solving problems and creating business value.
This is where so many talented engineering leaders stumble. We get caught up in the technical details, but stakeholders don’t really care about “reduced script flakiness”—they care about “more reliable and predictable release schedules.” You have to be the translator.
Instead of saying something like this:
“We’ll automate 300 test cases to run in our CI/CD pipeline.”
Reframe it for business impact:
“By automating our core regression suite, we can slash our release validation cycle by 48 hours. That means we can ship new features to customers two full days faster every single time.”
See the difference? You’ve just connected a technical task to a business metric everyone in the room understands and values. It shifts the entire conversation from what you’re doing to what the business is getting.
A wall of text or a dense spreadsheet can make eyes glaze over. To really drive the point home, you need to visualize the ROI in automation. Simple charts and dashboards are your best friend here because they tell a clear “before and after” story at a glance.
You don’t need fancy software for this. A clean, well-organized table can be one of the most powerful visuals in your entire presentation. It gives everyone a snapshot of the value delivered and makes the benefits impossible to ignore.
Here’s a quick look at how you can present the data from your pilot. It instantly shows the massive improvements across key metrics and, most importantly, ties them to a bottom-line number.
| Metric | Baseline (Manual) | Pilot Result (Automated) | Improvement (%) | Projected Annual Savings |
|---|---|---|---|---|
| Regression Cycle Time | 72 Hours | 4 Hours | 94% | $95,000 (Faster Releases) |
| Manual QA Hours/Release | 120 Hours | 10 Hours | 92% | $66,000 (Labor Cost) |
| Critical Defects Leaked | 4 per Quarter | 1 per Quarter | 75% | $40,000 (Reduced Rework) |
| Total Annualized Value | $201,000 |
This kind of visual makes the impact undeniable. It’s clean, direct, and speaks volumes. For more tips on how to present data to leadership, check out these effective reporting strategies for team updates to management.
Remember, your business case is a sales document. Its job is to persuade, build confidence, and secure the investment you need. When you focus on a clear story, speak the language of the business, and use simple data visuals, you turn a technical request into a strategic no-brainer.
https://www.youtube.com/embed/Fzi4T94QCjw
When we talk about traditional test automation, the ROI calculation is pretty straightforward. You put in the time to write a script, and it saves you manual testing time every time you run it. It’s a classic linear return. But when you bring AI into the picture, that old math goes out the window. We’re no longer just saving hours; we’re unlocking exponential value that simply wasn’t on the table before.
This shift means we need a new way to think about and model our returns. To build a truly compelling business case for a tool like TestDriver, you have to look beyond the obvious and account for gains that change the very nature of QA work.
The first place you’ll see a night-and-day difference is in test creation. Anyone who has been in QA for a while knows the grind of scripting every single action, locator, and assertion by hand. AI-powered platforms completely flip that model on its head, letting you generate entire end-to-end tests from a simple, plain-English description.
Think about a common task: scripting a comprehensive test for a new user onboarding flow. I’ve seen senior SDETs spend a full 8-hour day getting that right. With a good AI agent, you can often knock out the same test—generated, reviewed, and ready to go—in less than an hour.
Let’s put some numbers on that.
That’s a 90% reduction in test creation effort right there. This isn’t just a line item on a budget; it fundamentally changes how fast your team can build coverage for new functionality, which directly impacts how quickly you can get features to market.
Test maintenance is the silent killer of many automation programs. It’s a massive resource drain. Industry studies often show that teams can burn up to 30% of their time just fixing brittle tests that break every time a developer makes a small UI change. This is another area where AI delivers a massive, almost unbelievable, return.
AI-driven tests can “heal” themselves. When a button’s ID changes or an element moves, the AI is smart enough to figure out what the test was trying to do and automatically update the script. No more failed builds from a simple CSS tweak.
This changes test maintenance from a reactive, soul-crushing chore into a proactive, automated process. The ROI isn’t just about the hours saved; it’s about freeing your best engineers from fixing old, flaky tests so they can focus on building new value.
Let’s play that out. Imagine you have a suite of 500 tests, and about 5% of them (25 tests) break with every release. If each fix takes, on average, 30 minutes, your team is spending 12.5 hours on maintenance every single cycle. An AI with self-healing capabilities could wipe out 80% or more of that work, giving you back nearly a full day of engineering time.
Finally, AI brings a strategic layer to automation that’s often overlooked. How do you decide what to automate? Too often, it’s based on gut feelings or which developer is shouting the loudest. AI can replace that guesswork with data. By analyzing user behavior analytics, it can pinpoint the exact user flows that are most critical to your business.
This data-driven approach to test selection is a game-changer for risk management. You start focusing your automation firepower where it delivers the most value.
The ROI in automation here is measured in risk reduction and smarter resource allocation. It’s not just about running tests faster—it’s about running the right tests. This is what separates a truly advanced QA organization from the rest: using technology to ensure your quality efforts are protecting the business where it matters most.
Whenever teams start digging into the numbers behind automation ROI, the same tough questions always pop up. These are the practical, real-world concerns that can derail a business case if you’re not prepared. Getting ahead of them with clear, honest answers is how you build the trust you need to get your project across the finish line.
Let’s walk through some of the most frequent challenges I’ve seen come up in these conversations. Think of this as your field guide to navigating the tricky parts of the ROI discussion and turning potential objections into solid arguments for your case.
One of the first hurdles is always putting a number on things that don’t have a clear price tag. How do you quantify better team morale or increased developer confidence? While you can’t assign a direct dollar value to feelings, you can absolutely measure their impact through proxy metrics.
These are the tangible data points that tell the story of your engineering culture’s health. For instance:
In your business case, frame these gains as “risk reduction” or “operational stability.” You’re not just making people happier; you’re building a more resilient, stable, and efficient team.
Sooner or later, every stakeholder will ask, “When do we get our money back?” It’s a fair question, and the honest answer is: it depends on the scope. A massive, multi-year overhaul will take longer than a targeted pilot project.
That said, a good rule of thumb is that most organizations aim to see a positive return within 12 to 18 months.
This is where a pilot program becomes your secret weapon. A well-planned pilot can often show a positive ROI in as little as three to six months. It gives you a quick, tangible win that builds momentum and silences the skeptics. When you build your full ROI model, project your costs and benefits over a three-year horizon to really drive home the long-term value.
Don’t promise an overnight miracle. Set clear, realistic expectations. Frame automation as a compounding investment where the biggest returns build over time as the test suite matures and maintenance becomes more efficient.
Ignoring maintenance is the single biggest mistake people make when calculating ROI. An automated test suite is a living product, not a “set it and forget it” project. It needs continuous care and attention as your application changes.
These ongoing costs are a non-negotiable part of the “Investment” side of your ROI formula. Here’s a practical way to estimate them:
By including these realistic ongoing costs, you’re presenting a transparent and honest financial picture. It proves you’ve thought through the entire lifecycle of the investment, not just the exciting launch. That level of diligence is what builds real stakeholder confidence and gets your budget approved.
Ready to see how AI can transform your QA process and deliver an undeniable ROI? TestDriver helps you generate end-to-end tests from simple prompts, slashing creation time and maintenance costs. See it in action at https://testdriver.ai.
Discover how artificial intelligence in automation testing is revolutionizing QA. Learn practical strategies, key benefits, and how to implement AI today.
Discover the 12 best codeless automation testing tools for web, API, and mobile. Our 2026 guide helps you choose the right platform for your QA workflow.
Discover how quality assurance in software development works. Learn modern QA processes, key testing types, and how AI is revolutionizing software delivery.
Master software testing in DevOps with our guide. Learn shift-left, automation, CI/CD integration, and AI-driven testing to boost quality and release speed.
TestDriver uses computer-use AI to test any app - write tests in plain English and run them anywhere.