Mastering testing website in different browsers: A Practical Guide
Learn how to master testing website in different browsers with practical strategies, automation tips, and real-world debugging insights.
Master the art of testing websites on different browsers. This guide covers how to build a testing matrix, write robust tests, and fix bugs efficiently.
Automate and scale manual testing with AI ->
Ensuring your website works everywhere isn’t just a “nice-to-have”—it’s a fundamental part of building a successful product. Cross-browser testing is the process of making sure your site looks and behaves as intended on all the different browsers your audience uses, from Chrome and Safari to Firefox and Edge. If you skip this, you’re gambling with your user experience.
Without a solid testing plan, you’re essentially shipping a broken product to a chunk of your users, and you won’t even know it until they’re gone.
In a perfect world, the code you write for one browser would work exactly the same in all the others. But we don’t live in that world. We’re dealing with a fragmented landscape of dozens of browser versions, running on different operating systems and a dizzying array of devices. Ignoring this complexity isn’t a technical shortcut; it’s a direct route to lost revenue and frustrated customers.
Think about it in real-world terms. Imagine your e-commerce site has a sneaky JavaScript bug that only affects Safari on iOS, making the “Add to Cart” button completely useless. Or what if a key dashboard on your B2B platform breaks on an older, but still mandated, version of Microsoft Edge at a major corporate client? These aren’t just hypotheticals—they happen all the time when cross-browser compatibility is an afterthought.
When you decide not to test on different browsers, you’re basically telling a segment of your users that their experience doesn’t count. The fallout is predictable and painful:
The goal here is simple: deliver a reliable, high-quality experience for every single user, no matter what tech they’re using. Thankfully, modern tools and a smart workflow make this entirely manageable for any team.
Take market share, for example. Google Chrome dominates with a staggering 65-69.4% of the global browser market. That means roughly 3.7 billion people use it. Prioritizing Chrome is a no-brainer, but ignoring everyone else means consciously turning away millions of potential users. You can dig deeper into these numbers by checking out browser compatibility trends from recent industry analyses.
Deciding where to focus your cross-browser testing efforts can feel like you’re trying to boil the ocean. The key isn’t to test everything—that’s a fast track to burnout. The real goal is to test what actually matters to your specific audience by making smart, data-driven decisions.
Your first move should be to dive straight into your own analytics. Tools like Google Analytics are an absolute goldmine, showing you exactly which browsers, operating systems, and screen resolutions your users are on. Don’t get distracted by global market share stats; your user base is unique, and your data will tell you their story.
This is where you can really see the fragmentation from the browser all the way down to the individual user.
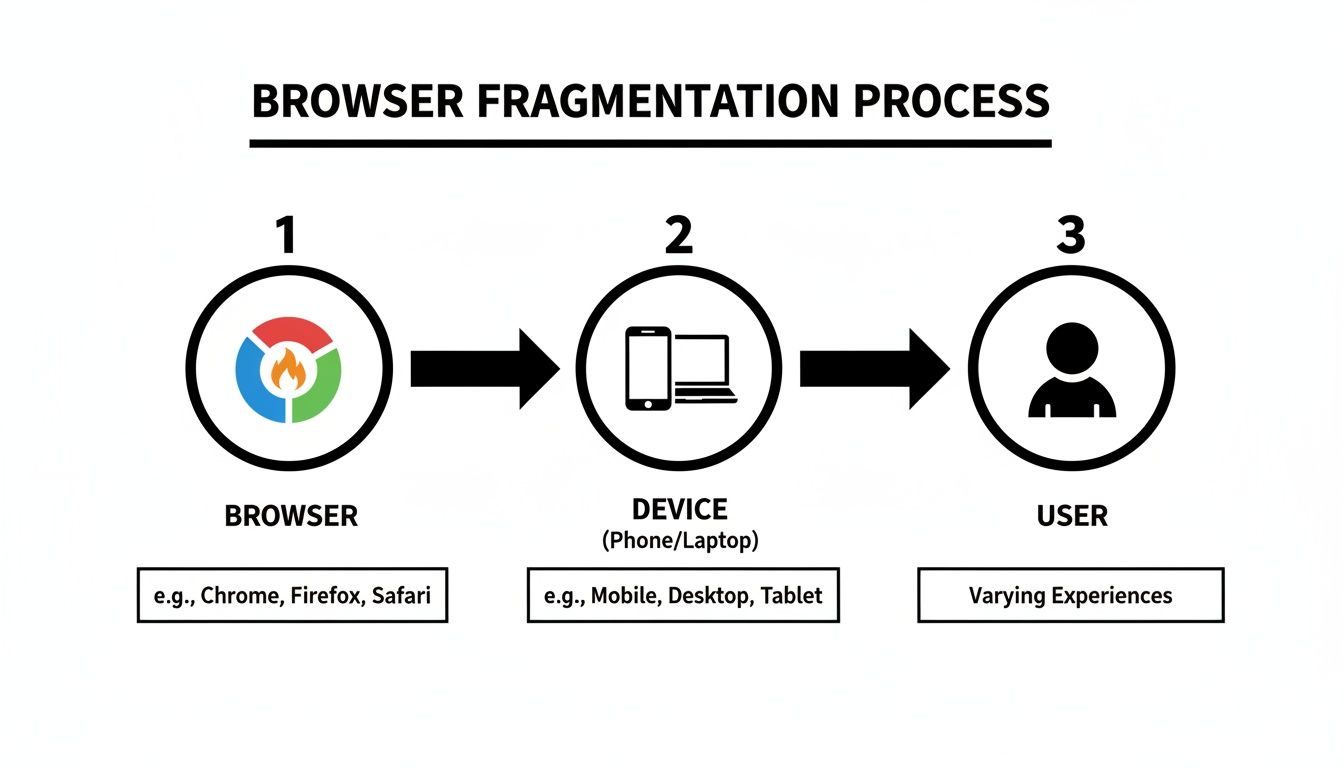
This flow really drives home why a one-size-fits-all approach just doesn’t work. Each of those combinations represents a totally distinct user experience that you need to account for.
Once you have that user data in hand, you can build a browser matrix. Think of it as a prioritized hit list of environments for testing. I’ve found a tiered approach is the most effective way to manage your time and resources, especially if you don’t have a massive QA department. It helps organize your testing into logical, manageable buckets.
Here’s a simple way to structure it:
A well-defined matrix transforms your testing from a random guessing game into a strategic operation. It gives your team clear priorities and ensures your most valuable user segments always get a bug-free experience.
Your matrix needs to go beyond just browsers and also account for screen resolution and device type. I’ve seen countless sites that look perfect on a desktop browser only to completely fall apart on a mobile viewport because of layout shifts or tiny, unusable touch targets.
This is where understanding your site’s design philosophy becomes critical. To really get a handle on the design principles that demand this level of testing, it’s worth exploring the nuances of Adaptive vs. Responsive Design. This knowledge helps you anticipate where problems are most likely to pop up before you even start testing.
For example, if your analytics show a huge chunk of your traffic comes from tablets with a specific resolution, that combination absolutely deserves a spot in your Tier 1 or Tier 2 list. When you integrate device data, your matrix becomes a true reflection of how people actually interact with your site in the wild. It’s a methodical approach that ensures you spend your time and energy protecting the user experience where it counts the most.
Once you have your browser matrix locked in, it’s time to get your hands dirty and write the actual tests. The real goal here is to build scripts that are resilient enough to run reliably when you start testing websites on different browsers. It’s a common trap: a test passes on Chrome but inexplicably fails on Firefox due to a tiny timing difference. That’s not a browser bug—it’s a poorly designed test.
The secret to a solid automated test lies in how it finds elements on the page. If you’re relying on flimsy selectors like CSS classes or dynamic IDs, you’re just setting yourself up for flaky tests that break every time a designer sneezes. The professional approach is to use stable, purpose-built locators.
A robust testing strategy really begins with your element selectors. Think of them as the foundation of your house; if they’re weak, the whole thing comes crashing down. You need unique identifiers that aren’t going to change every other development cycle.
Here’s what works in the real world:
**data-testid**** Attributes:** This is the gold standard, no question. Adding something like data-testid="login-button" to your HTML creates a dedicated hook just for your tests. It’s totally separate from styling or functionality—a clear, explicit contract between your code and your automation scripts.role="button" or role="dialog" is a fantastic two-for-one. Not only do you make your site more accessible, but you also get clear, semantic hooks for your tests to grab onto.Prioritizing selectors in this order will give you a test suite that’s far less brittle and way easier to maintain. For a deeper dive, there are some excellent best practices for writing automated tests in Playwright that cover selector strategies in more detail.
Let’s walk through a classic scenario: testing a user login. A fragile, amateur test might grab an element using a CSS path like #main-content > div:nth-child(2) > button. The moment a developer adds a new div, that test is toast.
A much smarter approach uses those stable selectors we just talked about. Here’s a quick look at what that code might look like:
// Test: User can successfully log in with valid credentials
test(‘should allow a user to log in’, async ({ page }) => {
// Navigate to the login page
await page.goto(‘/login’);
// Fill the email field using its accessible name await page.getByLabel(‘Email’).fill(‘user@example.com’);
// Fill the password field using its placeholder text await page.getByPlaceholder(‘Password’).fill(‘SecurePassword123’);
// Click the login button using its dedicated test ID await page.getByTestId(‘login-submit-button’).click();
// Assert that the user is redirected to the dashboard
await expect(page).toHaveURL(‘/dashboard’);
});
See the difference? This test is readable, practically self-documenting, and won’t break at the drop of a hat. It interacts with the app just like a real person would, focusing on labels and roles instead of the fragile internal structure of the DOM.
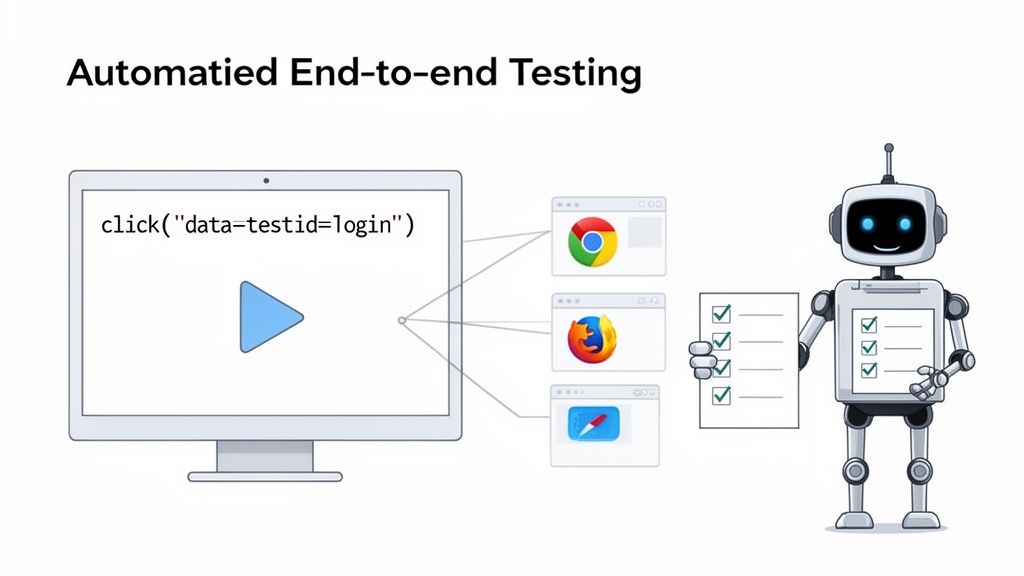
This really gets to the heart of what we’re doing—letting code-driven tests do the heavy lifting of validating user experiences across all the browsers that matter.
Now, writing these tests by hand, even with best practices, takes time and a certain level of technical skill. This is where AI-powered tools are starting to completely change the game, making high-quality test automation accessible to more people.
Instead of meticulously scripting every click and keystroke, you can now give an AI agent a simple, high-level instruction and have it generate the test code for you. This absolutely supercharges the test creation process.
Imagine telling a tool like TestDriver something like, “Verify that a user can log in with valid credentials and sees an error with invalid ones.” The platform can take that plain-English intent and spin up a fully-functional, resilient test script using all the best practices we just covered. This doesn’t just save a ton of time; it empowers more team members—even those who aren’t expert coders—to contribute to quality. It’s a huge shift, making truly comprehensive cross-browser testing a reality for more teams than ever before.
Having a suite of solid, well-written tests is a huge step, but they’re not doing you any good just sitting there. To actually protect your user experience, you need to run them consistently. This really boils down to two key environments: on a developer’s local machine and automatically within your Continuous Integration (CI) pipeline.
Running tests locally is all about getting that immediate feedback. Before a developer even commits their code, they should be able to run the entire test suite on their own computer. Think of it as the first line of defense against regressions. It helps catch bugs just minutes after they’re created, and that tight feedback loop is incredibly efficient.
This “local-first” approach keeps simple, avoidable errors from ever polluting the main codebase. It lets developers fix their own mistakes right away, saving the rest of the team from the headache of debugging something that could have been squashed much earlier.
Let’s say a developer is trying to fix a tricky CSS bug that only pops up on Firefox. The old way involved making a change, pushing the code, waiting for the CI pipeline to run, and then finally seeing the results. That’s a huge time sink.
With local testing, they get instant validation. Here’s how that usually plays out:
This kind of rapid, iterative process makes a massive difference. It shortens development cycles and helps build a real culture of quality from the ground up.
Once code gets pushed to a shared repository like GitHub, your CI pipeline takes over as the automated gatekeeper. Plugging your cross-browser tests into the pipeline turns them from a manual chore into a powerful, automated safety net. This is where you connect your test suite to cloud-based testing grids.
Platforms like BrowserStack or Sauce Labs give you instant access to thousands of real browser and device combinations. For a deep dive into how these platforms operate, check out this comprehensive guide to using BrowserStack for effective testing. Connecting to one of these services lets you run your test suite against your entire browser matrix with every single code change.
Your CI pipeline becomes the definitive source of truth. A green build means the code is safe to deploy. A red build immediately stops the process, preventing a bad release from ever reaching your users.
Setting this up means configuring your CI workflow—whether you use GitHub Actions, Jenkins, or CircleCI—to trigger your test command on every push or pull request. The workflow tells your test runner to execute the suite across every configuration in your matrix: Chrome on Windows, Safari on macOS, Firefox on Linux, you name it.
If even one test fails on a single browser, the entire pipeline fails. This immediately alerts the team that something is wrong before it ever becomes a customer-facing problem.
A failed test isn’t the end of the world; it’s the start of an investigation. When your automated suite throws a red flag on a specific browser, it’s handing you a breadcrumb trail. Your job is to follow it, and more often than not, it leads straight to a subtle difference in how browsers interpret your code.
This whole process is the core of what makes testing websites on different browsers so valuable. That bug you see in Firefox but not in Chrome isn’t just an annoyance—it’s a critical insight into the quirks of different rendering engines. These are exactly the kinds of issues that developers miss when they only test on their favorite browser.
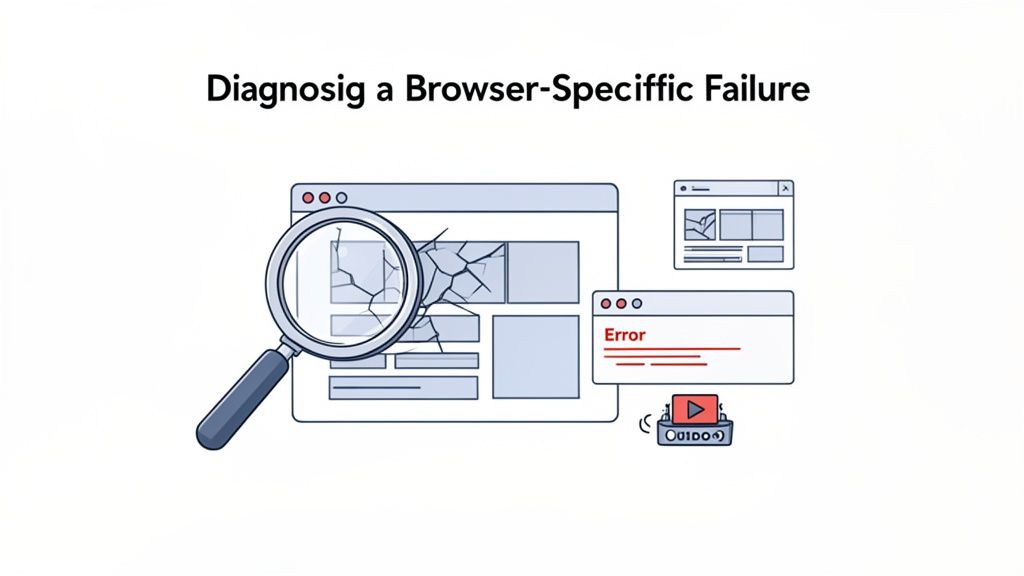
Your first move in any debugging session should be to gather the evidence. Modern CI pipelines and testing platforms are a goldmine for this, generating a rich set of artifacts for every single test run. Don’t just glance at the “failed” status and move on—dig into the data.
These are the tools that will become your best friends:
With these artifacts, a vague failure report transforms into a concrete starting point. Instead of spending hours trying to manually reproduce a bug, you have a complete record of what went wrong. This can easily slash your debugging time from hours down to just a few minutes.
While every bug has its own unique personality, you start to see the same culprits pop up again and again in cross-browser testing. Knowing what to look for helps you zero in on the problem a lot faster. It’s always a good idea to keep a practical guide to fixing cross-browser compatibility issues handy for a more structured approach.
Some of the most common headaches I’ve run into include:
The key is to approach each failure systematically. Use the test artifacts to form a hypothesis, then jump into the browser’s developer tools to test that theory directly on the problematic browser. This methodical approach turns debugging from a frustrating guessing game into a repeatable, efficient process.
Even with the best strategy in place, a few common questions always pop up when teams dive into serious cross-browser testing. Let’s tackle them head-on, so you can move forward without any lingering doubts.
Honestly, there’s no magic number here. The answer isn’t about testing everything; it’s about testing what matters to your users.
Your analytics data is your single source of truth. A great starting point is to cover the browsers that make up 80-90% of your user traffic. For most, this will be the latest versions of Chrome, Safari, and Firefox.
Once you have that baseline, you can get more specific. Is a significant chunk of your audience on an older version of Edge because they’re enterprise users? Add it to the list. The goal is to maximize your impact, not chase an impossible dream of 100% coverage.
This is a classic question, but it’s the wrong one to ask. It’s not a competition. The real answer is that you absolutely need both, because they solve different problems.
Think of it this way: your automated suite is the safety net that catches functional bugs, while manual testing ensures the experience actually feels right to a human being.
The smart play is to use a combination of both. Emulators and simulators are brilliant for the bulk of your testing, especially early on. They’re fast, cheap, and excellent for catching layout issues across different screen sizes and resolutions.
But—and this is a big but—they can’t perfectly mimic the hardware quirks, battery drain, and unpredictable network conditions of a real device.
For your most critical user journeys, and definitely before a major release, you have to validate your app on a handful of popular real devices. This final sanity check confirms that what worked perfectly in the simulator also works flawlessly in your users’ hands.
Ready to accelerate your testing workflow? TestDriver helps you generate robust end-to-end tests from simple text prompts, saving your team hours of manual scripting. Get started with AI-powered test generation today.
Learn how to master testing website in different browsers with practical strategies, automation tips, and real-world debugging insights.
Discover how to approach testing a website in different browsers. Learn to build a testing matrix, automate workflows, and ensure a flawless user experience.
Master testing a website on different browsers with a modern workflow: plan tests, configure environments, and automate checks for consistent experiences.
Implement risk based testing to focus your QA efforts. Learn a step-by-step process to identify, prioritize, and automate tests for critical user flows.
TestDriver uses computer-use AI to test any app - write tests in plain English and run them anywhere.